Plot charge/spin Density/MOs...
Summary
Use the Analysis of the electronic density tool to analyze the distributions of electronic density, spin density, individual molecular orbitals and arbitrary linear combinations of them including calculations of the difference/sum of electronic densities of different molecules from different electronic structure calculations.
For example you can build difference ("deformation") density, etc.
Density can be built as 3D durface, contour maps (two-dimensional) or as a distribution function along the given line (one-dimensional scanning). You can also calculate the density in an arbitrary set of points.
Usage
To show the Analysis of the electronic density window click the menu Tools --> Analyze electronic density.
To build densities, original (output) file with the electronic structure calculation must contain the data about basis set used:
Note to Gaussian users: type #P pop=full GFInput in Gaussian input files. (#P option enables extended printout, pop=full enables printout of all molecular orbitals coefficients needed to calculate density and GFInput option enables printout of basis set data (description of primitives in basis set)
1 - specify here function to calculate; there are two types of functions:
To build Advanced-function click the icon
icon
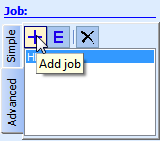
and follow the instruction (where the example of plotting of the difference density distribution map is considered)
After one or several Advanced-functions are added choose the one that you want to build, check the building parameters and press the Go! button.
2 - Geometrical data should be specified here:
- Point in plane (A) - the second point on a plane (determines "oX" axis)
- Point in plane (B) - the third point, to determine the plane
These three points will determine the plane for a map:
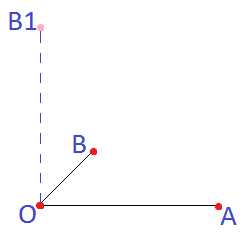
As was stated above point B determines the plane. But to determine second "oY" axis point B1 will be selected as presented on the figure.
3 - Click "Go!" button to start the building process with the specified parameters. After it is pressed it is titled "Stop", press it to interrupt the building process.
4 - Here the Job details will be described.
5 - Specify the following options here:
Other options like axes color, background color, fonts can be specified in the options window (to show it click the menu Edit --> Edit chart options):
Export plot
When a density distribution (function) is built you may choose to:
A vector format is preferable because it can be made any size without losing quality and becoming pixelated.
Use the Analysis of the electronic density tool to analyze the distributions of electronic density, spin density, individual molecular orbitals and arbitrary linear combinations of them including calculations of the difference/sum of electronic densities of different molecules from different electronic structure calculations.
For example you can build difference ("deformation") density, etc.
Density can be built as 3D durface, contour maps (two-dimensional) or as a distribution function along the given line (one-dimensional scanning). You can also calculate the density in an arbitrary set of points.
Usage
To show the Analysis of the electronic density window click the menu Tools --> Analyze electronic density.
To build densities, original (output) file with the electronic structure calculation must contain the data about basis set used:
Note to Gaussian users: type #P pop=full GFInput in Gaussian input files. (#P option enables extended printout, pop=full enables printout of all molecular orbitals coefficients needed to calculate density and GFInput option enables printout of basis set data (description of primitives in basis set)
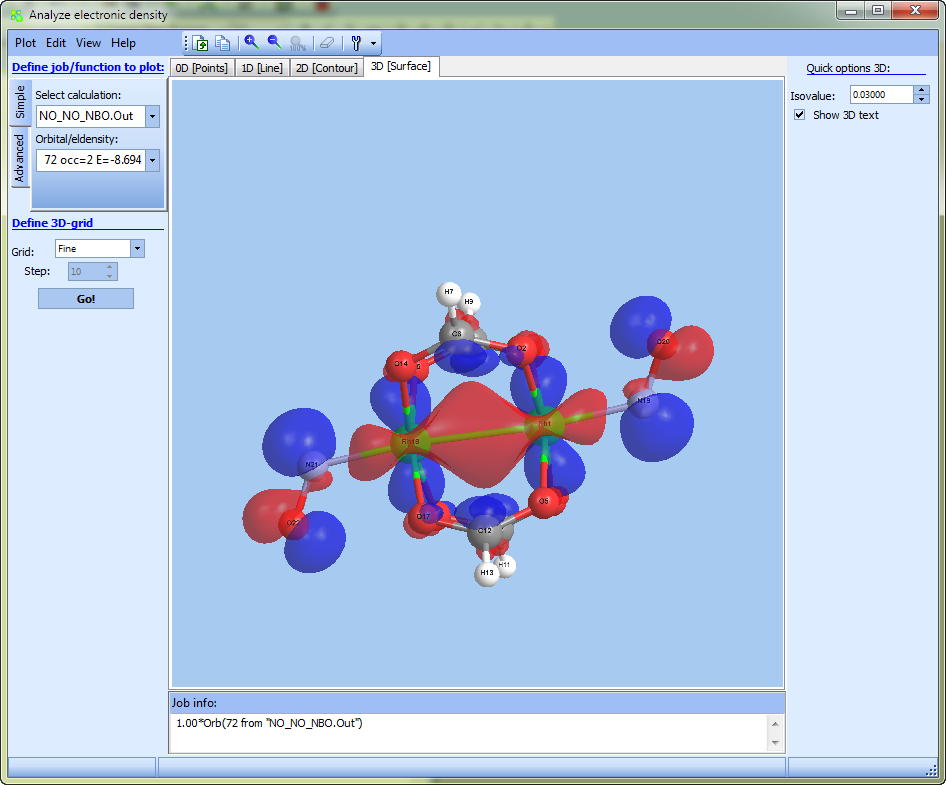
To plot 3D surface click "3D [surface]":
Consider building process of "2D" density distribution map (i.e. contour maps):
The figure below presents the main elements of the window for working with densities:
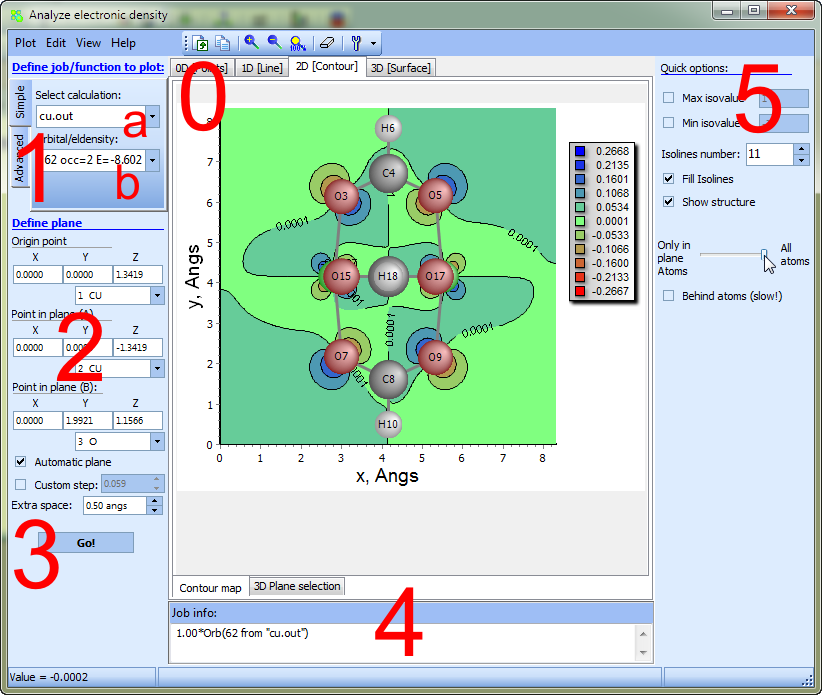
0 - specify here building mode:
- 1D - function 1 along a straight line
- 2D - two-dimensional contour map of function 1
- 3D - three-dimensional surface of function 1
- 0D - calculate values of function 1 in an arbitrary set of points
1 - specify here function to calculate; there are two types of functions:
- Simple-function, i.e. electron density / spin density / individual molecular orbital of one molecule; To build simple-function select in the drop-down list 1a one of the available calculations of a document. Then in the drop-down list 1b select a function to be built.
- Advanced-function is a linear combination of Simple-functions. It is particularly of interest when the document includes several calculations (of different molecules): Chemissan can build the difference density map i.e. difference of the first molecule density and the second molecule density (also you may subtract the third, forth... molecule densities). The latter is useful to estimate/analyze changes in density distributions when several small molecules (molecular fragments) combine to form the molecule.
To build Advanced-function click the
and follow the instruction (where the example of plotting of the difference density distribution map is considered)
After one or several Advanced-functions are added choose the one that you want to build, check the building parameters and press the Go! button.
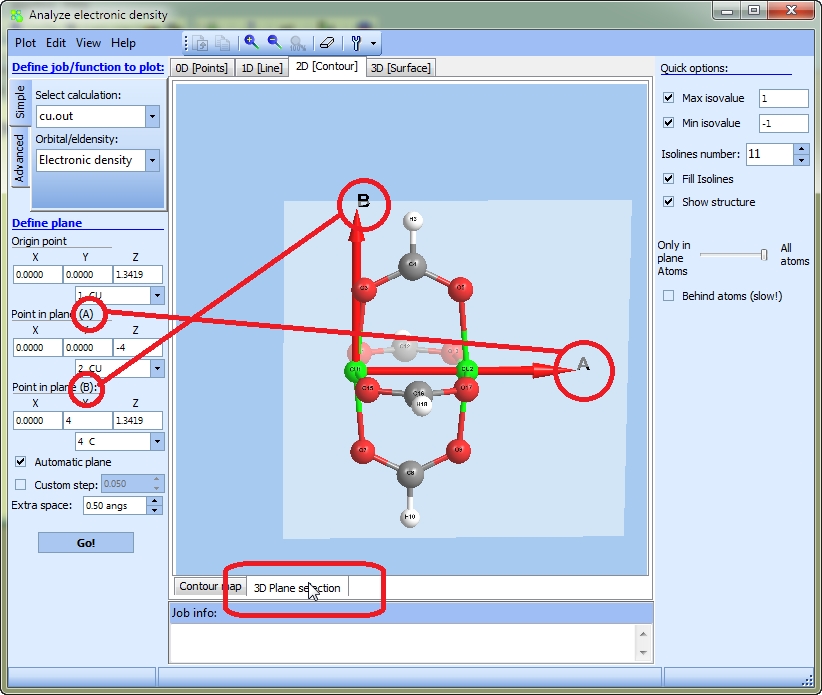
2 - Geometrical data should be specified here:
- in 2D mode three points must be specified:
- Point in plane (A) - the second point on a plane (determines "oX" axis)
- Point in plane (B) - the third point, to determine the plane
These three points will determine the plane for a map:
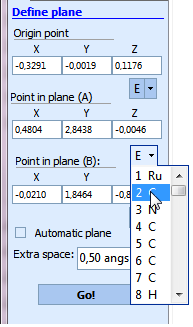
As was stated above point B determines the plane. But to determine second "oY" axis point B1 will be selected as presented on the figure.
- To specify the point coinciding with some atom use the button placed near the coordinate field:
Note that it possible to preview a plane by clicking "3D plane selection":
- Check the Automatic plane item to extend the plane bounds automatically to cover the projections of all atoms
- Specify the Extra Space parameter to determine some additional extension (in angstroms) of plane bounds
- if custom step is unchecked then an automatic determination of the step will be used(so that the building process took ~ 3 seconds);
3 - Click "Go!" button to start the building process with the specified parameters. After it is pressed it is titled "Stop", press it to interrupt the building process.
4 - Here the Job details will be described.
5 - Specify some options here:
- specify the function cut parameter by checking the "Value cut" item and setting min/max values
- number of isolines
- style - fill or not the gaps between isolines
- show/hide molecular structure (atoms and bonds). Use trackbar to show only atoms with the distance to plane (in the percentage of maximum distance) less then trackbar value.
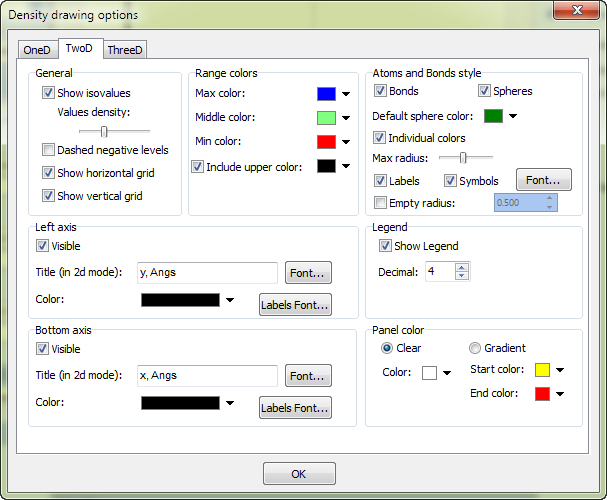
Other options like axes color, background color, fonts, drawing parameters of atoms can be specified in the options window (to show it click the menu Edit --> Edit chart options):
Consider building process of 1D function (i.e., scan along the specified line):
1D mode allows to scan spin/charge electron density or molecular orbitals (or their linear combination) along a given line.
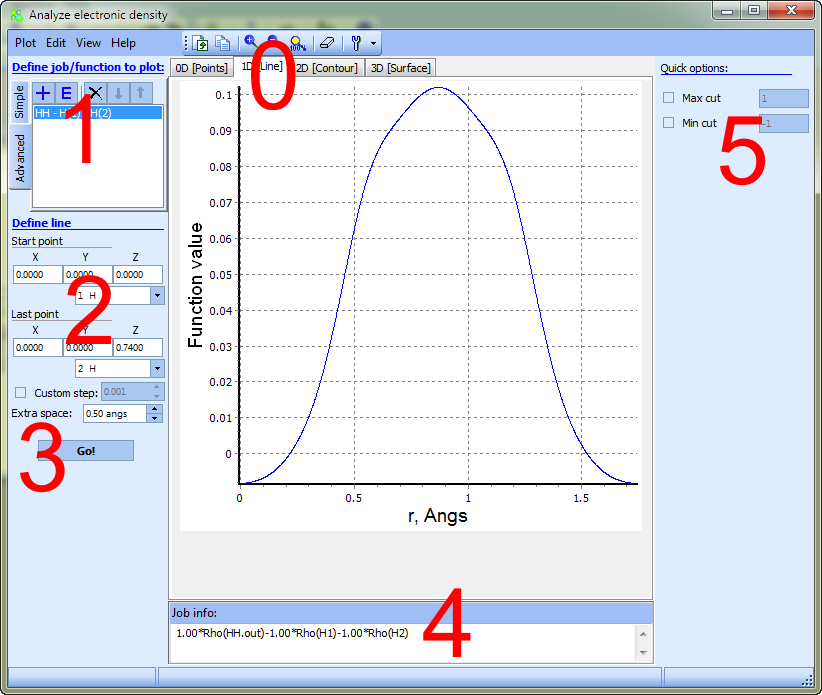
2 - Geometrical data should be specified here:
- In the 1D mode two points (to determine line) should be specified; along the latter function 1 will be built.
- Specify an Extra Space parameter to determine some additional extension (in angstroms) of segment bounds
- If "custom step" is unchecked then the automatic determination of the incremental step will be used (so that the building process took about 3 seconds).
3 - Click "Go!" button to start the building process with the specified parameters. After it is pressed it is titled "Stop", press it to interrupt the building process.
4 - Here the Job details will be described.
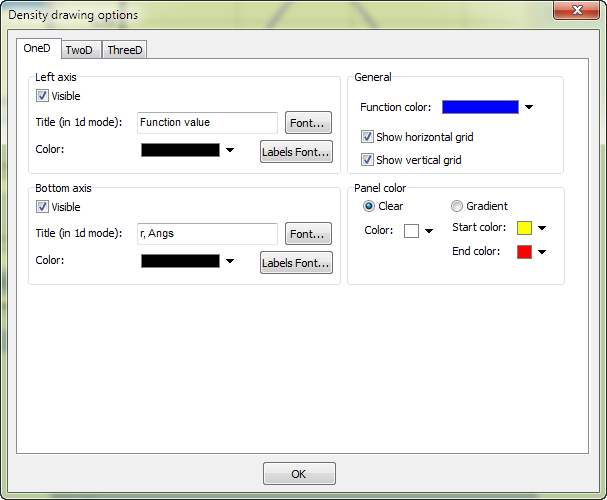
5 - Specify the following options here:
- Specify the function cut parameter by checking the "min/max cut" item and setting min/max values
Other options like axes color, background color, fonts can be specified in the options window (to show it click the menu Edit --> Edit chart options):
Export plot
When a density distribution (function) is built you may choose to:
- Save the plot as a picture: click the Plot-->Export... menu and in file filter select the raster *.bmp format or vector *.emf format;
A vector format is preferable because it can be made any size without losing quality and becoming pixelated.
- Copy the diagram as a picture to the clipboard and paste it in another editor (e.g. Word where you are preparing your publication): Select the Plot-->Copy image to clipboard menu or use Ctrl+B shortcut.
"0D" - calculate density in a custom set of points:
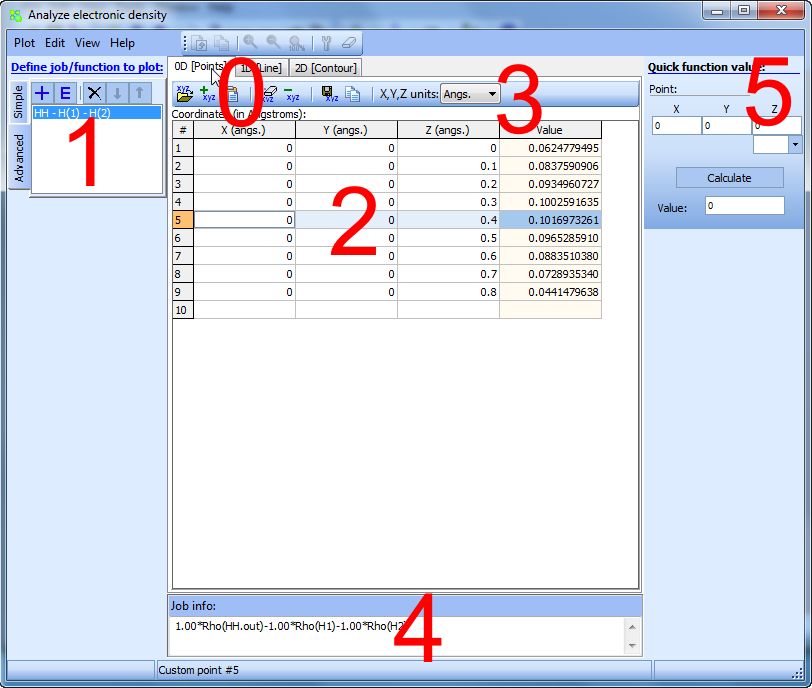
You can also calculate specified function 1 in an arbitrary set of points.
2 - Specify in this table the required set of coordinates of points where you want to calculate the function 1Function values will be calculated automatically in the fourth column as you enter the coordinates.
3 - Use this toolbar to manage xyz data:
- Load the set of points from text file in *.xyz format (three colums with x, y and z cartesian coordinates).
- Add row in table
- Paste xyz-data from clipboard (e.g., from msExcel or your text-editor)
- Clear table
- Remove selected rows in table
- Save the table in a text file
- Copy selected rows to clipboard
- You can also specify the measurement units X, Y, Z coordinates (Angstroms of Bohr radii (a.u.))
4 - Here the Job details will be described.
5 - Here you can calculate the function value 1 in a point